In this chapter we will show that classical picture of the diffusion cannot be kept on the nanoscale. Different examples for diffusional nanoscale effects, we have discovered recently. Interface shift kinetics may be different form the ones predicted by continuum approximations (anomalous kinetics). Moreover we show that in solid state reactions, reaction layers form and start to grow highly off-stoichiometrically and an initially existing stoichiometric compound layer may dissolve then re-form off-stoichiometrically. Our findings are of primary importance for nanotechnologies where early stages of SSR are utilized. We also show that an initially diffused interface may sharpen even in completely miscible systems. This phenomenon could provide a useful tool for the improvement of interfaces and offer a way to fabricate of e.g. better
X-ray or neutron mirrors, microelectronic devices or multilayers with giant magnetic resistance.
A variety of different experimental techniques (AES/XPS and synchrotron facilities) has been used to prove the above theoretical findings in different systems (e.g. Ni/Cu. Ni/Au, Si/Ge, Co/Si).
3.1 Introduction
In the last 5-10 years, we have been intensively working on computer simulations and experimental investigations of interface motion and transformation. With still continuously shrinking device structures, the question of how the microscopic laws may change on the nanoscale appears of utmost importance. This is not only interesting from fundamental point of view but also of practical interest. Planning and fabrication of nanoscale devices need better understanding of the atomic scale processes. A possibly new behaviour could help to improve the properties of devices or hinder their destruction.
Different examples for diffusional nanoscale effects, we have discovered recently, will be given in this contribution. [ErdelyiSurfSci2002, ErdelyiPRB692004, KatonaPRB2005, BaloghAPL2008, BekePRB2006, ErdelyiAPL2008] We will illustrate that interface shift kinetics may differ form the ones predicted by continuum approximations (anomalous kinetics). These findings led us to investigate solid state reaction kinetics. We will show that in many realistic cases reaction layers form and start to grow highly off-stoichiometrically. Moreover an initially existing stoichiometric compound layer may dissolve then re-form off-stoichiometrically. [ErdelyiAPL2008] We will also show that an initially diffused interface can sharpen even in completely miscible systems. [ErdelyiPRL2002, ErdelyiPRB2003]
A variety of different UHV-based techniques have been used to prove the above theoretical findings. The interface shift kinetics has been measured by means of surface analytical techniques (AES, XPS) during dissolution of thin films into semi-infinite substrates: Ni/Cu(111), Ni/Au(111), Si/Ge (111), a-Si/a-Ge. Solid state reactions in Co/Si system has been studied by synchrotron X-ray diffraction and also by using synchrotron facilities we have performed depth profiling and Extended X-ray Absorption Fine Structure (EXAFS) analysis in waveguide structure, which are rather new methods. [ErdelyiXRS2009] The interface sharpening has been measured by synchrotron X-ray diffraction. [ErdelyiScience2004]
3.2 Validity of the continuum approximation in multilayers —
Continuum models deteriorate on the nanoscale
Cook et al. showed that the continuum and discrete approximations give the same results only if the wavelength of the modulation $$\Lambda$$ is at least six times longer than the interatomic distance, $$d$$, in the direction of the diffusion $$(\Lambda > 6d)$$. Cahn and Yamauchi and Hilliard found the similar range of validity of the continuum approach for intermixing of multilayers. These conclusions, however, are obtained in linear approximation, i.e. assuming that the diffusion coefficient is independent of concentration. The treatment of the effects of this type of nonlinearity is very complicated even if one neglects the stress effects. Tsakalakos and Menon and de Fontaine tried to treat this problem analytically, or by solving the continuum equations numerically, considering a concentration dependence no stronger than a quadratic one in the diffusion coefficient, although even in ideal solutions it can be stronger and is better described by an exponential dependence.
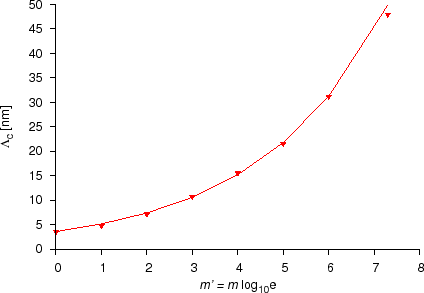
We showed that in case of an exponential dependence of the diffusion coefficient (section Diffusion asymmetry) the discrete and continuum approximations give the only if modulation length of a multilayer is larger than $$3$$ to $$50$$~nm ($$\Lambda > 3 – 50$$~nm), depending on $$m’$$, i.e. on the strength of the composition dependence of the diffusion coefficientm or other words, how large the diffusion asymmetry is. For details see Ref. [ErdelyiPhilMag1999] and [ErdelyiPhD].
3.3 Sharp interface shift
3.3.1 Computer simulations
To investigate the interface kinetics and morphology we used basically two types of models: continuum (see Volume diffusion) and discrete (atomistic) (see Discrete models). The advantage of the continuum models over atomistic ones is that stress effects can easily be included. However the validity of the continuum models is limited on the nanoscale, especially if the diffusion coefficient ($$D$$) is composition dependent (see Diffusion asymmetry). The range of the validity of the continuum model shifts strongly with increasing $$m’$$ and, in many real thin- or multilayer systems with typical characteristic length of few nanometers, it may break down.
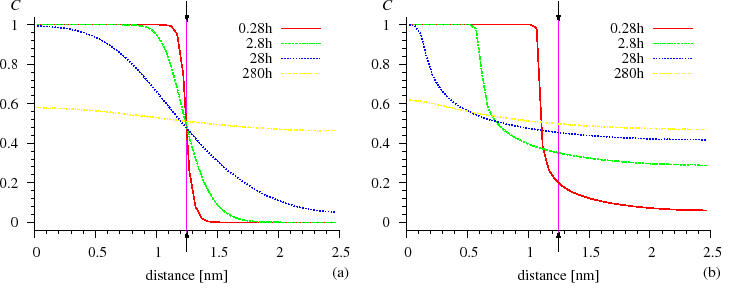
However, both from the discrete and continuum models, we obtained that the development of the composition profiles is quite symmetrical for composition independent $$D$$, whereas, for strong composition dependent $$D$$ (strong diffusion asymmetry), the composition profiles are very asymmetric. The interface between the $$A$$ and $$B$$ matrixes remains abrupt and shifts until the component in which the diffusion is slower is no longer consumed. It can be seen in Fig. SiGe composition profile} that the Si atoms diffuse very fast into the Ge matrix and are distributed homogeneously, whereas the Ge atoms practically cannot penetrate into the Si matrix, since the diffusion is more than $$4$$ orders of magnitude faster in the Ge than in the Si [ErdelyiPhilMag1999].
3.3.2 Experiments
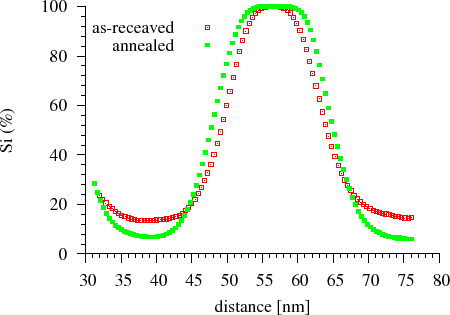
Amorphous Si/Ge multilayers with nearly equal thickness of sublayers were prepared by dc magnetron sputtering. The nominal thickness of the Si and Ge sublayers was $$18$$~nm, the total thickness of the multilayer was $$180$$~nm. The asymmetric development of the composition profile was shown by measurement of the time evolution of the composition profile by the Auger depth profiling technique. It was shown that, during annealing, the Si atoms diffuse into the Ge and are homogenised there. As a consequence, the interface shifts towards the Si resulting the thinning of the Si layer and thickening of the initial Ge layer, within which, the Si content increases (Fig. Auger depth profiling) [CsikJAP2001].
3.4 Interface shift kinetics — Anomalous (Non-Fickian) diffusion kinetics
It is known from Fick’s phenomenological laws that, during annealing of a diffusion couple, the displacement of a plane with constant composition (or an abrupt interface) is proportional to $$t^{1/2}$$ (Fickian or normal shift kinetics with $$t$$ equal to time) (section Boltzmann’s transformation, Parabolic law). However, as was shown above the validity of Fick’s laws is limited on the nanoscale, especially with increasing diffusion asymmetry (section Composition dependent diffusion coefficient – Diffusion asymmetry} and Validity of the continuum approximation in multilayers – Continuum models deteriorate on the nanoscale). Therefore, we revisited the problem of the interface shift kinetics on the nanoscale.
In order that we could systematically study the interface shift kinetics, we divided the problem into two parts. First we studied the completely miscible ($$V = 0$$, where $$V$$ is a solid solution parameter proportional to the mixing energy of the system) and phase separating ($$V > 0$$) systems. (section Interdiffusion) In these cases only
the shift of one interface is to be studied. Second, we investigated ordering systems, where the kinetics of two interfaces is to be followed since a growing new $$AB$$ ordered phase connects to both the pure $$A$$ and $$B$$ matrixes ($$A/AB/B$$). (section Interdiffusion)
3.4.1 Completely miscible ($$V=0$$) and phase separating ($$V>0$$) systems
3.4.1.1 Computer simulations and theory
To investigate the interface shift, we recorded sequentially the position of the interface of a diffusion couple [ErdelyiPRB692004] (section KMF). Its logarithm versus the logarithm of the time ($$\log p \propto \log t$$) was plotted. Fitting a straight line to the data, its slope gave the power of the function describing the shift of the interface (called kinetic exponent and denoted by $$k_c$$). Obviously for parabolic (normal Fickian) interface shift $$k_c=0.5$$. Thus if the kinetics is non-Fickian, $$k_c \neq 0.5$$ or the data do not fit on a straight line on the $$\log p \propto \log t$$ plot. Both the parameters $$m’$$ and $$V$$ (or $$V/kT$$) were changed during the calculations.
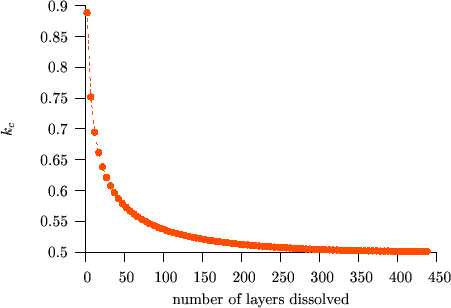
Figure $$k_c$$ vs. $$V/kT$$ shows the initial values of $$k_c$$ versus $$V/kT$$ for different $$m’$$ values. It can be seen that $$k_c$$ is almost constant and, as expected, is very close to $$0.5$$ for small $$m’$$. At the same time, the deviation from the square-root kinetics increases with increasing $$m’$$ for a fixed value of $$V/kT$$.
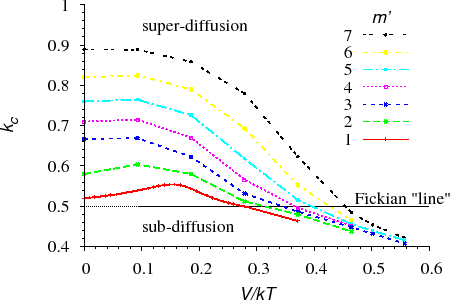
The deviation from the parabolic law is a real “nano-effect” because, after dissolving a certain number of layers (long time or macroscopic limit), the interface shift returns to the parabolic behaviour independently of the input parameters.(see e.g. Fig. $$k_c$$ vs. $$t$$)
We have shown [BekePRB2006], that this transition can be understood from the analysis of the atomic currents in the different parts of the sample. In principle three currents can be distinguished: i) $$J_\alpha$$ in matrix $$A$$, where the diffusion is very slow, ii) $$J_I$$ across the interface region and iii) $$J_\beta$$ in matrix $$B$$, where the diffusion is fast. (see Figs. Atomic fluxes and Atomic fluxes – animated) However, $$J_\alpha$$ can be neglected, because, practically, there is no diffusion in matrix $$A$$. Moreover, at the beginning of the kinetics, when the composition gradient is very large, the flux in the $$B$$-rich phase ($$\beta$$ phase) is larger than across the interface ($$J_I < J_\beta$$). In this stage $$J_I$$ controls the diffusion. During the process $$J_\beta$$ becomes smaller and smaller because the tail of the composition profile in the $$\beta$$ phase grows more and more resulting in the decrease of the gradient of the composition. Although, $$J_I$$ also decreases with increasing time/number of layers dissolved, $$J_\beta$$ decreases much faster. As a result, in a certain moment $$J_\beta$$ becomes smaller than the $$J_I$$, and from this point $$J_\beta$$ is the rate limiting term. Thus the transition time or thickness must be deduced from the condition $$J_I = J_\beta$$ which has to be fulfilled at the interface.
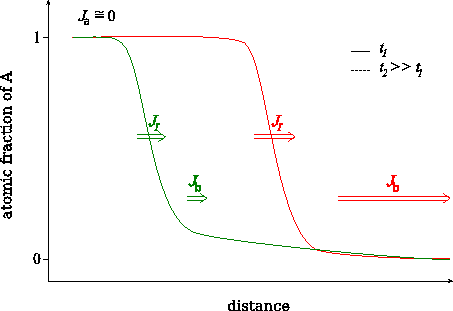
Change of the characteristic fluxes during intermixing.
It is worth mentioning that, from the analysis of the currents, an atomistic explanation of the phenomenological interface transfer coefficient ($$K$$) can also be made, which has been missing in the reaction diffusion literature. Following the phenomenological definition of $$K$$, $$J_I = K(c_e-c)$$ ($$c$$ and $$c_e$$ denote the current and the equilibrium composition at the interface, respectively) and, comparing this to the $$J_I$$ in the discrete model [BekePRB2006]
\begin{equation}
K \cong \nu z_v \exp (-Q_K/kT)
\label{eq:K}
\end{equation}
with $$Q_K = E_0 + z_l V + mkT/2$$ ($$E_0$$ is the saddle point energy, $$z_l$$ the lateral coordination number). $$K$$ is practically proportional to the jump frequency from the $$A$$-rich phase to the $$B$$-rich one. In fact the magnitude of the finite value of $$J_I \cong K$$ gives the permeability of the interface and it is determined by the $$m$$ and $$V/kT$$ parameters.
Although it is almost exclusively accepted in the literature that linear growth kinetics are the result of interface reaction control, our results suggest that the linear (non-Fickian) growth of a reaction layer on the nanoscale cannot be automatically interpreted by interface reaction. In the light of the above observations it seems
desirable to reformulate our results in the form of the linear-parabolic (or Deal and Groves [DealJAP1965]) law routinely used in the interpretation of experimental data for processes showing a transition between interface reaction and diffusion control (see e.g. Ref. [NemouchiAPL2005]). This was done in Ref. [BekePRB2006] and shown that the linear-parabolic transition or crossover thickness can be estimated from the following expression:
\begin{equation}
X’* \cong c_\beta D_\beta / 2K,
\label{eq:crossover}
\end{equation}
where $$c_\beta$$ and $$D_\beta$$ are the composition and the diffusion coefficients in the $$\beta$$ phase.
Experiments
The main idea in these experiments is to prepare a thin deposit onto the surface of a substrate, where the deposit is thin enough to be able to detect the signal coming from the substrate, i.e. the deposit is “transparent” for the experimental technique used. In this case the thickness of the deposit can be calculated from the ratio of the deposit and substrate signal intensities ($$I_{dep}/I_{sub}$$). During annealing, if the interface remains abrupt, from the change of $$I_{dep}/I_{sub}$$ ($$I_{dep}$$ decreases, whereas $$I_{sub}$$ increases in time) it is possible to determine how the thickness of the deposit decreases in time. The deposit thickness can easily be converted to interface position; i.e. the $$\log p \propto log t$$ function can be plotted, for which the slope is just equal to $$k_c$$.
Scheme of the measurement of interface shift.
Since according to the results of computer simulations different $$k_c$$ values are expected depending on the strength of the diffusion asymmetry ($$m’$$) and the phase separation tendency ($$V$$), we have investigated different systems: an ideal (Ni/Cu) and a phase-separating (Ni/Au) system. Moreover we also wanted to check if the anomalous interface shift kinetics is independent of the sample structure and diffusion mechanisms, thus we have also performed measurements in the amorphous Si/Ge system, which is also ideal. Then, to be able to compare the results for the same system but with different structure, we have repeated the measurements but in crystalline Si/Ge.
Ni/Cu(111) system ($$m’ \cong 5$$, $$V \cong 0$$ — ideal).
To investigate the interface shift kinetics in the Ni/Cu system we deposited $$3-14$$ monolayers Ni onto a Cu(111) single crystal. The samples were heat treated in the temperature range of $$600-730$$~K and the dissolution process was followed by in-situ AES measurements. From the analysis of the change of the Ni($$848$$~eV) and Cu($$920$$~eV) signals, we have determined the interface shift kinetics and we obtained that the interface shift is proportional to the time ($$k_c \cong 1$$) and not to its square-root as predicted by Fick’s theory.
Moreover, we have shown that if the interface shift kinetics is proportional to the time, the speed of the interface shift is constant. The speed can be determined from the interface shift kinetics easily. From the interface shift speed an intrinsic diffusion coefficient of Ni in a $$\text{Ni}_{78}\text{Co}_{12}$$ alloy can be
deduced; which is just equal to the $$K$$ interface transfer coefficient [ErdelyiSurfSci2002]:
\begin{equation}
D \equiv K =2.9 \exp \left(-\frac{(297 \pm 62) \text{kJ/mol}}{RT} \right)\text{m}^2/\text{s}.
\label{eq:D_K_NiCu}
\end{equation}
Ni/Au(111) system ($$m’ \cong 6$$, $$V \cong 0.019$$~eV — phase separating).
In order to check the validity of the computer simulation results obtained also for phase separating systems, we repeated the above experiments but with the Ni/Au system (solubility $$\approx 3 \%$$ at about $$T = 680$$~K, $$V = 0.019$$~eV). Here $$3$$~nm thick Ni was deposited onto the surface of a Au(111) single crystal and the dissolution process was investigated by in-situ XPS measurements in the temperature range of $$643-733$$~K. We have determined kc from the change of the ratio of the integrated Au-4f and Ni-2p core line intensities. The values of $$k_c$$ at different temperatures are $$k_c \cong 0.6 – 0.7$$ . These values show that the kinetics is anomalous in this case.
Amorphous Si/Ge system ($$m’ \cong 3$$, $$V = 0$$ — ideal)
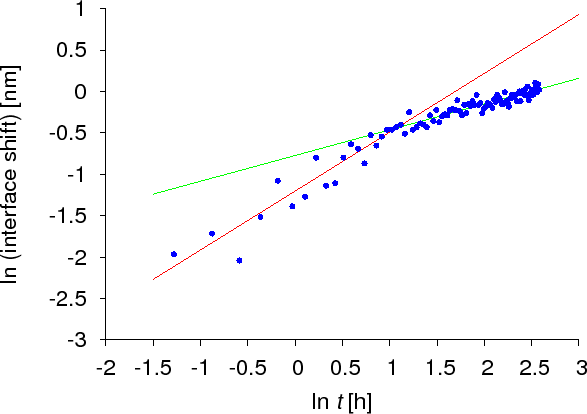
As was presented above, several theoretical and experimental studies of diffusion kinetics on the nanoscale have shown that the time evolution differs from the classical Fickian law. However, all work so far was based on crystalline samples or models. To reveal if there are kinetic anomalies in amorphous systems, the dissolution kinetics of a thin amorphous Si layer into amorphous Ge was carried out. The interface shift was monitored by AES and XPS techniques. Figure Interface shift – SiGe shows how the interface shifts in time. As can be seen, two domains can be identified corresponding to two different lines having different slopes. This means that the kinetic exponents are different for the two domains. Initially $$k_c$$ was found to be $$0.7 \pm 0.1$$, whereas in the later domain it was $$0.5$$. Therefore not only the anomalous part of the diffusion process could be observed but also the transition back to the classical Fickian behaviour was seen.
Crystalline Si/Ge(111) system ($$m’ \cong 4-5$$, $$V = 0$$ — ideal).
To be able to compare the results in case of the same system but with different structures, we have repeated the previously discussed measurements, but in crystalline Si/Ge in the temperature range of $$740-755$$~K. $$2-4$$~nm Si was deposited on the top of a Ge(111) substrate. We have found a $$k_c$$ value of $$0.85 \pm 0.1$$. The diffusion lengths were around $$2$$~nm in two experiments, which is more than the largest non-Fickian $$\to$$ Fickian transition length observed for the amorphous system, but we have not found any change of $$k_c$$ indicating a larger transition length than in the case of the amorphous system. This is consistent with the larger $$m’$$ of this system.
3.4.2 Ordering systems ($$V<0$$) — Solid state reaction
3.4.2.1 Computer simulations
Computer simulations have shown that, during phase growth, the growth kinetics (also the shift kinetics of the interface bordering the growing ordered phase) may be anomalous (non-Fickian) due to the diffusion asymmetry and not because of the interface reaction control usually mentioned in solid state reactions [CserhatiJAP2008].
3.4.2.2 Experiments
Crystalline-Co/amorphous-Si system ($$m’$$ is uncertain, as in the literature there is a contradiction in the value of $$m’$$, $$V < 0$$ — ordering).
CoSi growth has been measured by XRD in the Co/Si system. [CserhatiJAP2008]. To measure the kinetics of the growth of an intermetallic layer during solid state reaction (SSR), we have prepared crystalline-Co/amorphous-Si multilayers. In this system, at lower temperatures (in our experiment: $$523$$~K and $$543$$~K) the crystalline CoSi is the only growing phase. At slightly higher temperatures (in our experiment: $$573$$~K and $$593$$~K) crystalline $$\text{Co}_2\text{Si}$$ also starts to grow, thus we could measure its growth kinetics simultaneously with the shrinkage of the Co and CoSi layers. The growth and shrinkage of the layers were measured by XRD. The areas of the corresponding peaks have been plotted (which are proportional to the thickness of the corresponding layers in our multilayer structure) as the function of time. (see Fig. CoSi experiment) We have found in all the cases that the kinetics is anomalous. [CserhatiJAP2008]. It is (very probably) due to the diffusion asymmetry and not because of the interface reaction control usually mentioned in solid state reactions. (for details see Ref. [CserhatiJAP2008].)
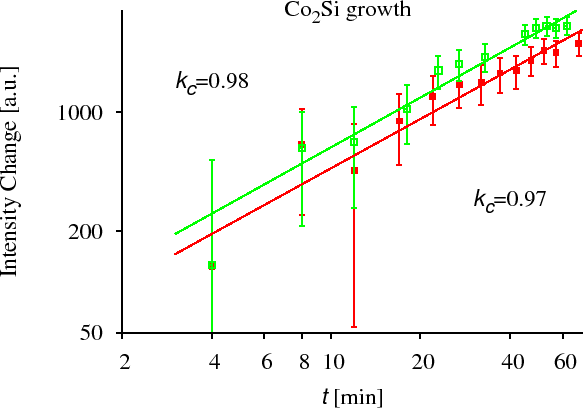
Since, however, these measurements do not provide direct composition profiles and any chemical information, which are important to study the early stages of any Solid State Reaction, we have performed complementary experiments: combined GIXRF (grazing incidence x-ray fluorescence) and EXAFS (extended x-ray absorption fine structure) experiments in a waveguide structure [ErdelyiXRS2009] as well as using the $$4$$ wire resistance method and TEM [CserhatiJAP2008].
3.5 Change of interface morphology
3.5.1 Interface sharpening in completely miscible alloys
3.5.1.1 Computer simulations
Using computer simulations, it was shown [ErdelyiPRL2002] that, on the nanoscale, for strongly composition-dependent diffusion coefficients, an initially diffuse $$A/B$$ interface can become chemically abrupt even in ideal (either crystalline or amorphous) systems with complete mutual solubility.
The sharpening can be qualitatively predicted from the classical Fick first law although it is not able to provide correct kinetics on the nanoscale. Since, in ideal systems, $$D$$ has a positive value, the direction of the flux is always opposite to the direction of the concentration gradient and, for concentration independent diffusion coefficients, this equation should lead to flattening of the interface. However, if $$D=D(c)$$ (where $$D(c)$$ is the concentration dependence), the flux $$j$$ depends not only on the concentration gradient but also on the local composition of the sample. Figure interface sharpening- simulation illustrates the ‘flux distribution’ at the interface in the initial state, when the film and the substrate are separated by a wide interface. As the concentration gradient is constant along the interface then, according to Fick’s first law, it is only $$D$$ on which the absolute value of the atomic flux depends. Therefore, in the case of concentration independent $$D$$ the
atomic fluxes, independently of the position, are the same, whereas in case of $$D=D(c)$$ the ‘flux distribution’ follows the $$D=D(c)$$ function.
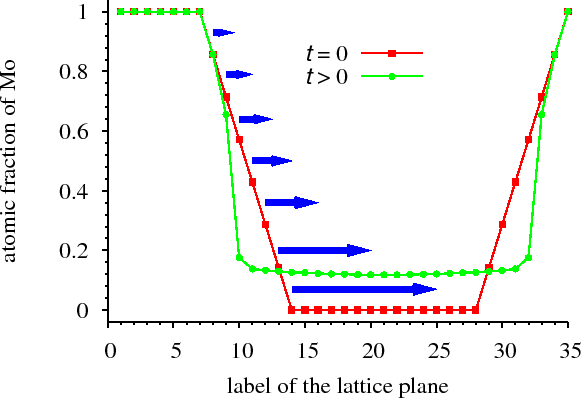
We have also shown that sharpening takes place where stress effects intervene. [ErdelyiPRB2003]
3.5.1.2 Experiments
We studied Mo/V multilayers. [ErdelyiScience2004] The structures ($$20$$ bilayers with a modulation length $$\approx 5-6$$~nm) were produced by magnetron sputtering. The pure Mo and V layers were separated by a roughly $$1.5$$~nm thick diffuse interface with a constant composition gradient. In order to follow the change of the composition profiles in-situ during heat treatment, x-ray measurements were performed at the KMC2 beamline at the BESSY synchrotron. Symmetrical scans between $$53^\circ$$ and $$66^\circ$$ of the scattering angle $$2\Theta$$ were performed, measuring the scattering intensity around the ($$002$$) Bragg reflection of the Mo/V multilayer structure.
We found from the reconstruction of the diffraction patterns that the interface sharpened during the heat treatment. This conclusion is also supported by the analysis of changes of the intensity ratios during heat treatment. [ErdelyiScience2004]
3.5.2 Dissolution and off-stoichiometric formation of compound layers in solid state reactions
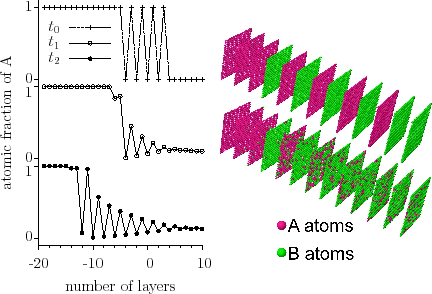
For ordering systems, i.e. in which a new phase forms and grows (solid state reaction) at the interface of a diffusion couple, we have shown that stoichiometric ordered phases at the interface of a bilayer (formed e.g. during sample preparation) may dissolve (even completely) during the annealing process. Later the ordered phase re-forms but highly non-stoichiometrically (Fig. non-stoichiometric). [ErdelyiAPL2008]
3.6 Summary
We have shown that the diffusion asymmetry influences the diffusion kinetics and interface morphology on the nanoscale independently of the sample structure, the chemical properties and diffusion mechanism.
Interface shift kinetics may be anomalous more often than expected. We have shown that in solid state reactions, reaction layers form and start to grow highly non-stoichiometrically and an initially existing stoichiometric compound layer may dissolve then re-form non-stoichiometrically. We have also shown that an initially diffused interface may sharpen even in completely miscible systems.
A variety of different UHV-based techniques has been used to prove the above theoretical findings in different systems.